S&P 500 and Nasdaq: New Targets and Support Levels
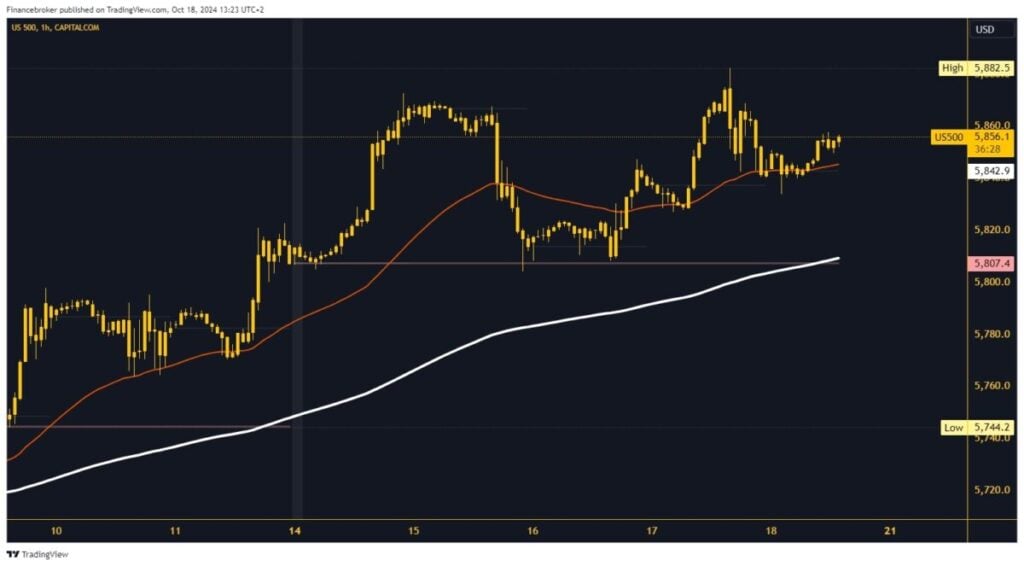
- During this morning’s Asian trading session, the S&P 500 finds support at the 5840.0 level
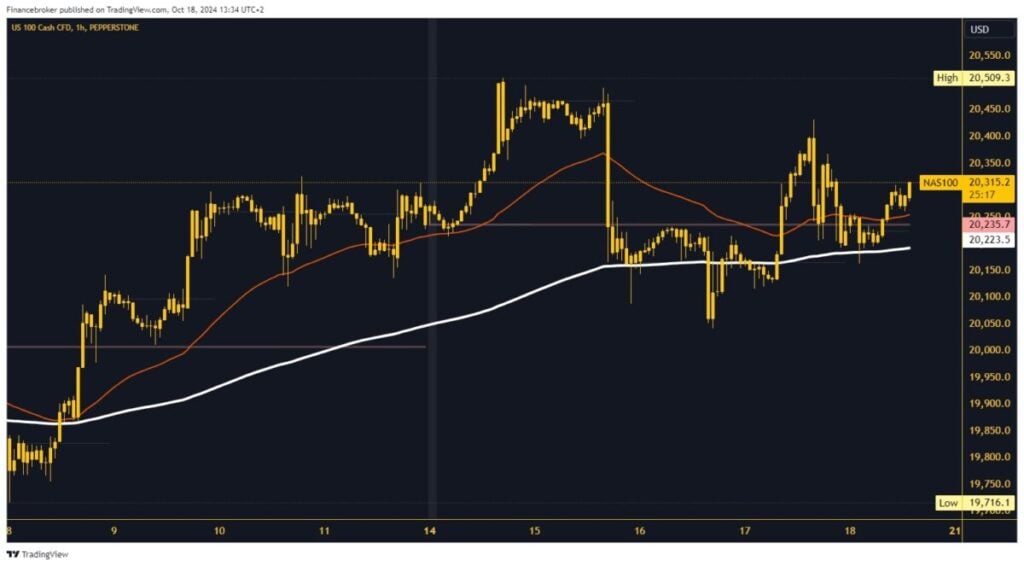
- The Nasdaq gained new support this morning at the 20200.0 level
S&P 500 chart analysis
During this morning’s Asian trading session, the S&P 500 finds support at the 5840.0 level. Additional support in that zone is the EMA 50 moving average, which influenced the index to remain stable. In the EU session, we climbed up to $5860.0, and we expect a continuation of the bullish side in the US session. On Thursday, October 17, the S&P 500 created a new all-time high at 5882.5. We managed to break above the previous high from Monday, October 14.
All signs indicate that we can expect a continuation of the bullish consolidation. Potential higher targets are 5880.0 and 5900.0 levels. If the current bullish momentum decreases, the S&P 500 could turn to the bearish side. After that, we will see a pullback below the 5840.0 level and the EMA 50 moving average. Since we lost the previous support, we must continue the retreat and look for a new one at lower levels. Potential lower targets are 5820.0 and 5800.0 levels.
Nasdaq chart analysis
The Nasdaq gained new support this morning at the 20200.0 level. With the support of the EMA 200 moving average, we quickly moved back above the weekly open level to the positive side and continued to the daily high at 20315.0. The index at 20250.0 forms a higher low and thus confirms determination for further recovery to the bullish side. Potential higher targets are 20350.0 and 20400.0 levels.
If there is a reduction in the bullish momentum again, the Nasdaq will have to start a new pullback. We are again forced to test the weekly open level and the support of the EMA 200 moving average. This time, we need a break of the index below to a new daily low as a confirmation of bearish momentum. Potential lower targets are 20150.0 and 20100.0 levels. This week’s Nasdaq low was at 20042.0.
The post S&P 500 and Nasdaq: New Targets and Support Levels appeared first on FinanceBrokerage.