Let’s dive into the Interactive Brokers Desktop platform—a much-needed update from the old Trader Workstation. This newer version is honestly a breath of fresh air, especially if you’re just starting out. I’ll show you how to set up your workspace, tweak chart settings, add technical indicators, handle orders, set up keyboard shortcuts, manage your watchlist, and use the stock scanners.
For context, I’ve been trading for over ten years, and Interactive Brokers TWS was my first real brokerage account. I still use it, so what you’ll get here is based on actual hands-on experience. The platform’s flexibility is a big plus, whether you’re into day trading with a bunch of charts or just want a simple layout.
IBKR Desktop Platform Breakdown
Getting started with IBKR Desktop app
Customizing desktop layout
Chart settings
Indicators
Order entry
IBKR Hotkeys
Watchlists & Options quotes
IBKR Screener
Final tips
Getting Started With IBKR Desktop App
Comparing IBKR Desktop and TWS Trader Workstation
IBKR Desktop is Interactive Brokers’ modern trading platform, and it’s a big shift from the old Trader Workstation (TWS) that’s been around forever. TWS platform feels pretty dated now, honestly.
The new IBKR Desktop app is just easier to use. You don’t need to be super technical to get around—it’s way more user-friendly than IBKR TWS ever was.
Enhanced Functionality and User Experience
The Interactive Brokers platform gives you a ton of options to make your workspace your own. You can play around with layouts, tweak chart settings, add indicators, set up order panels, hotkeys, watchlists, and screening tools.
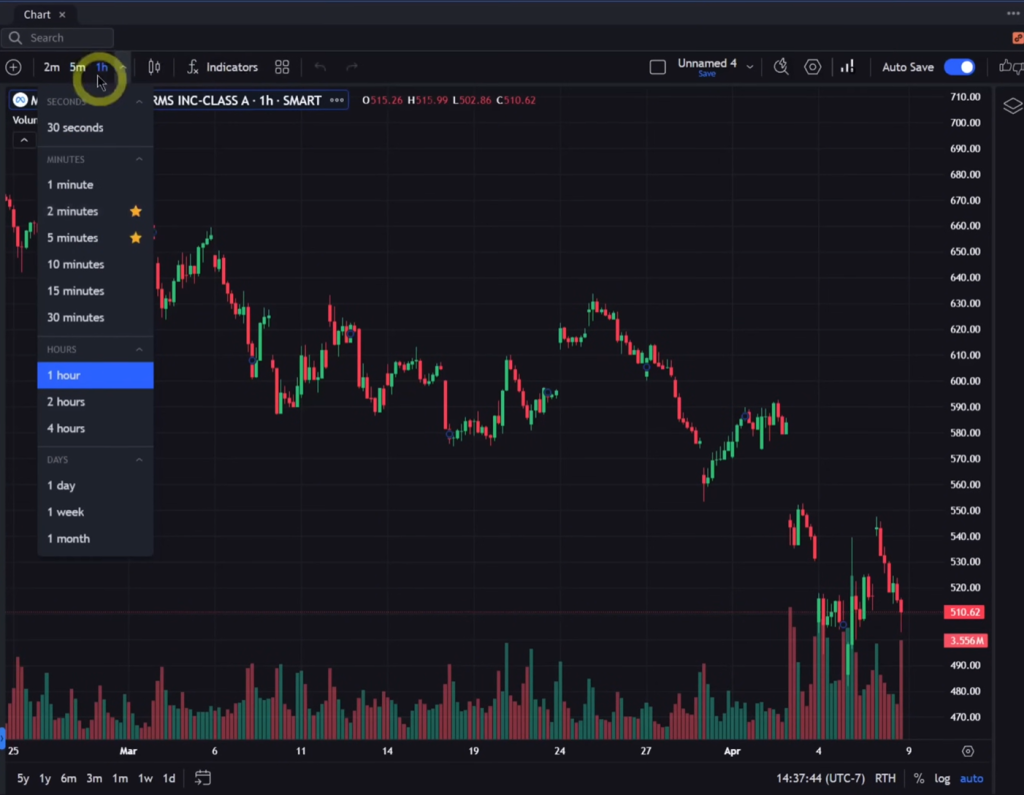
It uses Tradingview integrated charts, which are a lot more intuitive than the old TWS charts. Switching between time frames—like five-minute, two-minute, hourly, or daily—is quick and painless.
You can “star” your favorite time frames so they’re always handy up top. Chart settings let you adjust things like time zone, colors, and what elements you want visible—grid lines, crosshairs, status bars, that sort of thing.
Some standout customization features:
Multiple chart layouts with easy linking
Color and gradient tweaks for your own style
Extended hours display for pre-market and after-hours
Indicator templates you can save and reuse
Volume display options that can be separated out
You can link windows using color-coded icons. Change a ticker in one window, and every linked window updates too.
Easy to Use Platform Interface
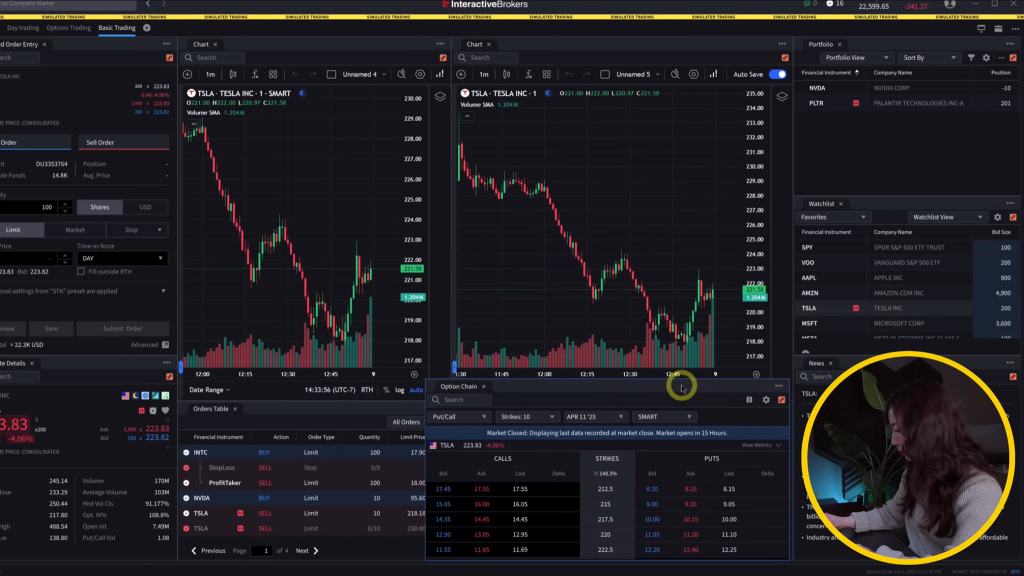
The IBKR Desktop app is a lot less intimidating than TWS. You can pick a default template such as “basic trading” and then make it your own.
Arrange windows however you want—side by side, stacked, whatever fits your style. Add charts, order panels, quote details, portfolios, watchlists, news feeds, all from the main menu. It’s pretty flexible.
Just a heads up, though: some things from TWS aren’t here yet. There’s no montage (level two market depth) or time and sales window, which might be a dealbreaker for some traders.
Adding indicators is simple—click the indicators button, pick from standards like VWAP or EMAs, and tweak settings like length or color. For volume, right-click and move it to a separate pane below the chart if you want. You can add moving average overlays to volume too, with custom periods like a 14 EMA.
Once you’ve got your chart just right, save those settings as a template. That way, you don’t have to redo everything for every new chart—it’s a huge time-saver.
Try out Interactive Brokers
Customizing the IBKR Desktop Layout
Choosing a Starting Template
Start by picking one of the built-in templates. Click the layout icon, choose the basic trading template, and you’re off to a solid starting point.
This gives you the basics—charts, order entry, watchlists. From there, move things around to suit your style.
Arranging Windows and Components
To add a new window, hit the window icon and pick what you want—charts, quote details, order entry, portfolio, etc.
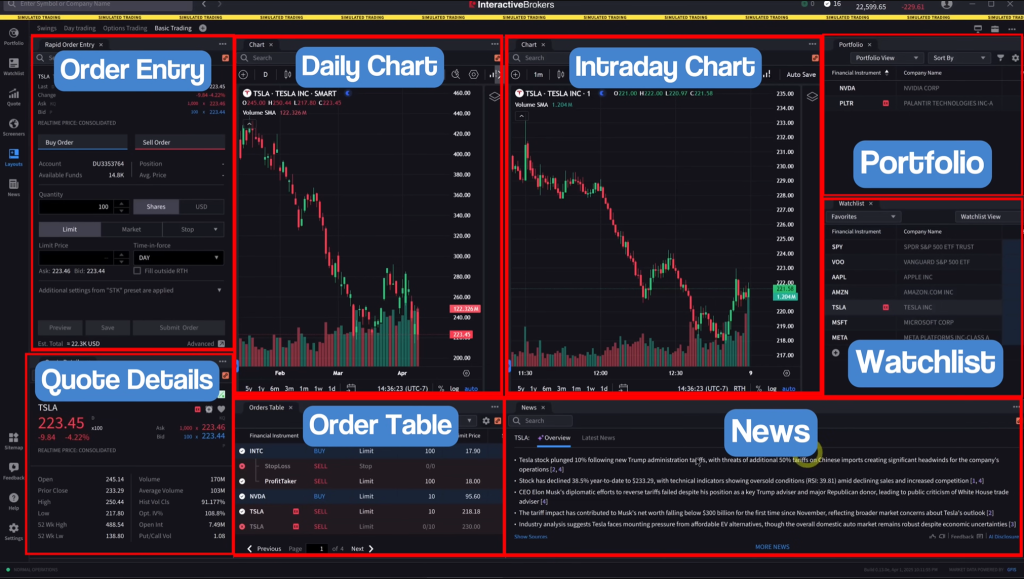
Drag and drop windows wherever you like. Stack them, line them up—whatever helps you stay organized.
Maybe put your daily charts on the left, intraday charts on the right, and keep order tables or quote details down below. Play with it until it feels right.
Just remember, features like level two data and time and sales aren’t here yet, so plan your layout with that in mind. Try different setups and see what clicks for you.
Synchronizing Windows with Color Links
Each window has a colored link icon. When you set the same color on multiple windows, changing a ticker in one updates all the others instantly.
Say you switch from one stock to META—every linked window will flip to META too. If you want to track different stocks in separate groups, just use different link colors for those windows. It’s pretty handy if you’re juggling a few tickers at once.
Make sure your main windows share the same link color so things stay in sync. It saves you from that “wait, why isn’t this updating?” headache during a busy session.
Preserving Your Workspace Configuration
Once your layout feels dialed in, save it. Click the chart settings icon, hit save, and give it a name—maybe “day trading” or “intraday five minute” so you know what’s what. You can have a bunch of layouts saved and swap between them as needed.
To load a saved layout, use the layout icon and pick “load layout.” Choose what you want and your workspace updates to match. It’s a big help if you trade different strategies or timeframes and don’t want to rebuild everything from scratch each time.
Customizing Chart Settings
Picking Chart Views and Intervals
Change chart time frames by clicking the selector at the top of the chart. You’ve got options like five minute, two minute, one hour, daily, and so on.
Star your go-to intervals so they’re always right there in the quick-access bar. Switching between them is fast—no digging through menus. Makes life easier if you need to jump between timeframes a lot.
Setting Your Time Zone and Display Options
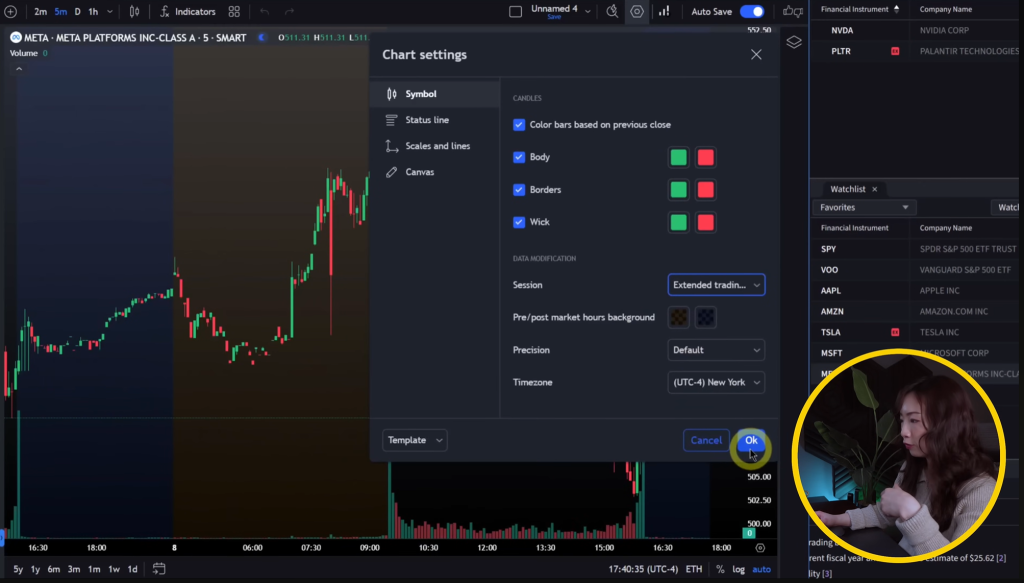
Right-click the chart, go into settings, and set the time zone to New York time. Even if you’re not in New York, this keeps your charts lined up with market hours.
In the canvas section, you can turn off grid lines completely or add a gradient for a bit of depth. The status line at the top is optional—hide it if you don’t use it. Crosshair color and other visuals are all customizable too, so you can make things look the way you want.
Modifying Chart Backgrounds and Visual Elements
Go into canvas settings to change background colors or add a gradient. Gradients can make the chart pop a bit, but don’t go too wild or it might get hard on the eyes.
Grid lines are optional—remove them if you want a cleaner look. You can also adjust indicator opacity so they don’t overpower the chart. Crosshair styling is there too, just pick what feels right for you.
Enabling Pre-Market and After-Hours Data
Extended hours trading is only available on intraday charts—such as five or two minute intervals. Daily charts just don’t show that option.
Head to chart settings, open the symbol tab, and turn on extended hours. Pre-market and after-hours prices will show up in different colors, so you can see what’s going on outside regular trading. It’s pretty useful if you’re watching movers before the bell or after close.
Try out Interactive Brokers
Using Indicators on Charts
Applying and Modifying Indicators
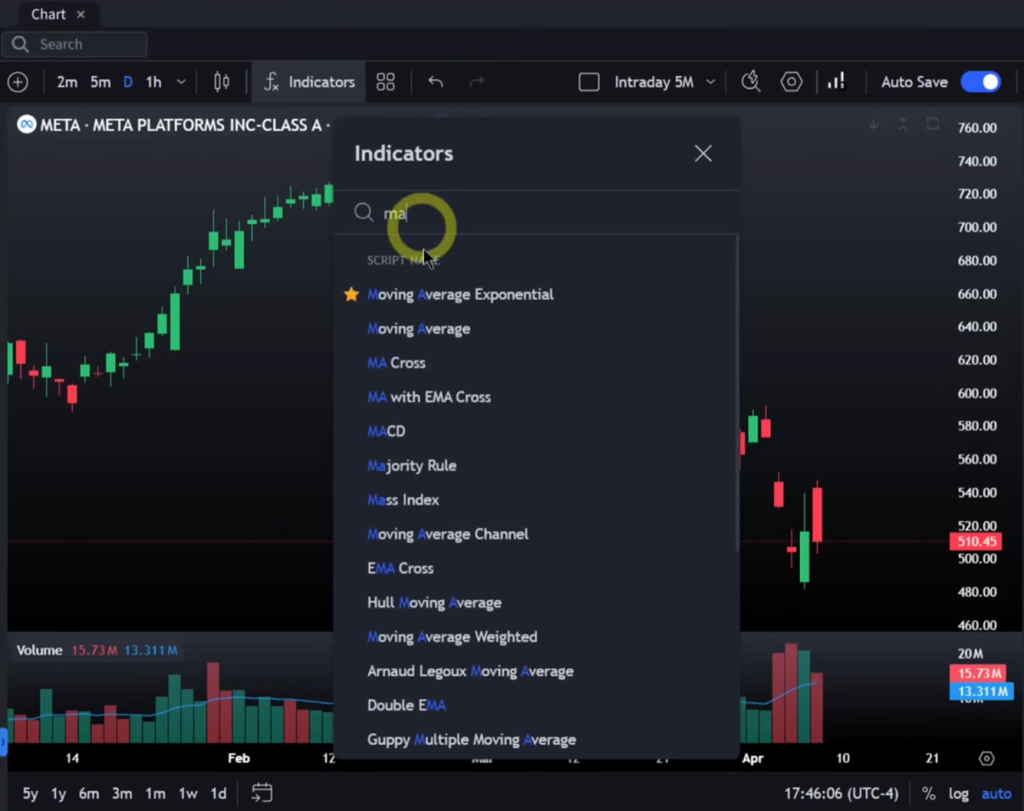
Click the indicators button on your chart to open up the list. The platform uses TradingView-style indicators, which are straightforward to use.
Add your favorite indicators from the list—VWAP, moving averages, whatever you need. Once added, they show up on your chart and in a collapsible panel.
To tweak an indicator, click the icon next to its name in the panel. You can change settings like period length or color. For volume, right-click and move it to a new pane below the main chart if you want it separated. You can also add a volume moving average—just set your preferred period, like a 14 EMA. Each indicator can be shown or hidden with a quick toggle.
Managing Indicator Panels
You can decide where indicators show up. Most overlay directly on the price chart, but stuff like volume is often easier to read in its own panel below.
Collapse the indicators list when you want a cleaner workspace. You’ll still have quick access to show, hide, or edit any of them. Stack as many indicators as you need—some work best overlaid, others in their own spots.
Storing Indicator Templates
Once you’ve got your indicator setup dialed in, save it as a template. Click the icon, pick “save indicator template,” and give it a clear name—maybe mention the timeframe and key indicators so you remember what’s what. You can choose to save the interval too.
Apply templates to other charts in a snap by loading them from the chart settings icon. Indicator templates and chart background settings are saved separately, though. If you want to keep your colors, grid, and background along with your indicators, use the chart settings save function. Loading a saved layout applies all your visual and indicator preferences at once.
Order Entry and Trade Management
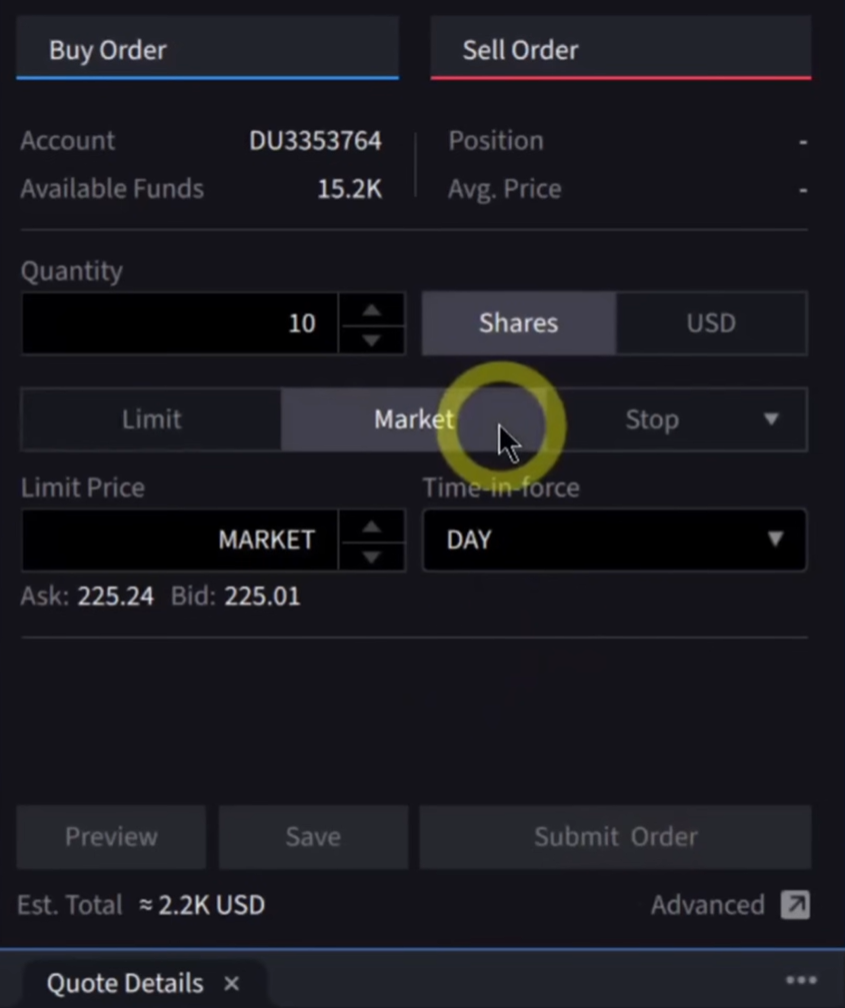
Submitting Market and Limit Orders
To get started, add the rapid order entry window to your layout. Just click the icon, pop open a new window, and pick rapid order entry from the menu.
You’ll see the order entry panel on the left side of your workspace. When you link this window using the colored link icon, it syncs up with your charts and other panels. Any ticker you select updates across every linked window at once—pretty handy, honestly.
Enter your ticker symbol in the order entry panel to place an order. The panel shows current quote details and lets you set order parameters. Pick your order type depending on your trading plan.
Exiting and Modifying Positions
The order table lives at the bottom of your workspace and lists all your orders. It gives you real-time updates on active orders and what’s been executed.
Your positions show up in the portfolio panel, which tracks your open positions and key info for each holding. It’s easy to keep an eye on your trades and see what’s happening as you go.
The quote details panel shows info about the stock you’re trading. It updates automatically when you switch ticker symbols anywhere in your linked windows.
Understanding Order Table and Status
The order table at the bottom tracks your trading activity. You can keep it next to panels like rapid order entry and quote details. It updates in real-time as you send and fill orders.
If you like to multitask, arrange panels side by side. Put the order entry on one side, order table on the other—you can submit orders and watch their status without flipping around.
The portfolio panel works with the order table to show you the big picture. The order table gives you the details, while the portfolio panel shows your overall positions. Both update as the market moves.
Trading Hotkeys Configuration
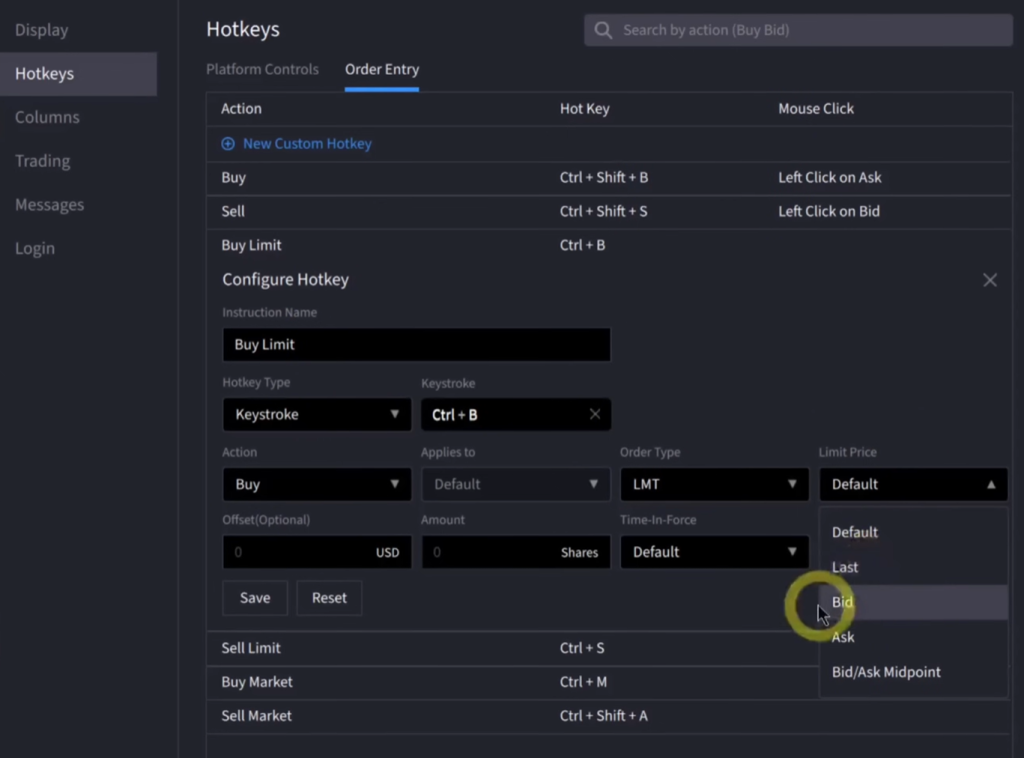
Configuring Custom Keyboard Shortcuts
You can set up keyboard shortcuts to speed up your trading workflow. Access hotkey settings through the platform’s configuration menu.
To customize, go to settings and assign keys to the trading actions you use most. This way, you can execute trades and move around the platform without endless clicking.
Assign shortcuts to actions you do all the time. The customization is flexible, so you can match your keyboard setup to your trading habits.
Executing Orders with Keyboard Shortcuts
With keyboard shortcuts, you can place orders fast—no need to grab the mouse every time. Set up hotkeys for your preferred order types and methods.
The rapid order entry system works with your shortcuts to make trading smoother. You’ll cut down the time between spotting an opportunity and actually placing your order.
Map shortcuts for buying, selling, or tweaking orders—whatever you do most. Pick keys that feel natural to you.
Keyboard Shortcut Restrictions
The IBKR Desktop platform is missing a few features you might expect. It’s worth noting what’s available and what isn’t.
For example, there’s no montage view with level two market data. That’s something some traders might really miss.
Time and sales data is also missing here. If you rely on those features, you’ll want to consider if this platform fits your trading style.
Try out Interactive Brokers
Managing the Watch List
Building and Modifying Watch Lists
You can link your windows using the colored link icons. Each window has a different color, and linking keeps everything in sync. Change a ticker in one window, and all linked windows will update instantly.
Say you switch to META in one window—every linked panel jumps to META too. Or, if you want, assign different colors to keep some charts on other symbols. Some folks like to set up several charts with different links, and that’s totally fine.
Just make sure you use the same link color across windows you want synchronized. The link icon is your friend here for keeping everything updated as you switch tickers.
Adjusting Watch List Columns
The watchlist sits in your layout next to other windows like charts, order entry, or portfolio. Drag and drop it wherever works best for you. The platform lets you arrange windows side by side or stack them vertically—it’s up to you.
Move windows around by clicking and dragging. Place the watch list where it fits with your trading tools. Maybe it’s next to charts or under order entry. Whatever feels right.
The watch list updates automatically when you switch symbols using the link system. All linked windows show the same ticker, according to your color setup.
Monitoring Positions and P&L
The portfolio window shows your current positions. Place it anywhere in your layout—next to the watch list, by your order table, wherever you like to keep tabs on your open trades.
It updates in real-time as your positions change. Just drag it to your favorite spot. Many traders keep it near the order table and watch list for a quick glance during the session.
You can build a layout with portfolio, watch list, news, quote details, order table, and charts—all linked and synchronized. Save your layout so you can pull it up later with everything just where you left it.
Options Trading Layout
Accessing the Options Workspace
If you trade options, open the options chain window by clicking the icon and finding the option chain in the menu.
Once you’ve got it, put it wherever you want in your layout. Don’t trade options? No need to add this window—just skip it.
To line up windows side by side, just drag and drop them into place. You could have the option chain next to your order table or tucked into a corner—whatever fits your workflow.
Examining Options Chain and Strategy Tools
The option chain window shows available contracts for your ticker. If all your windows are linked with the same color, changing the ticker updates the option chain automatically too.
Check that the link color in your option chain window matches your other panels. That way, everything stays in sync when you flip between stocks.
You can resize the option chain by dragging its edges. Place it so you can see strike prices and contract details right next to your charts or order entry.
Utilizing the Stock Screener
Building Your Own Scanners
Access the screener by clicking the toolbar icon and picking the scanner option. There are default templates if you want a quick start.
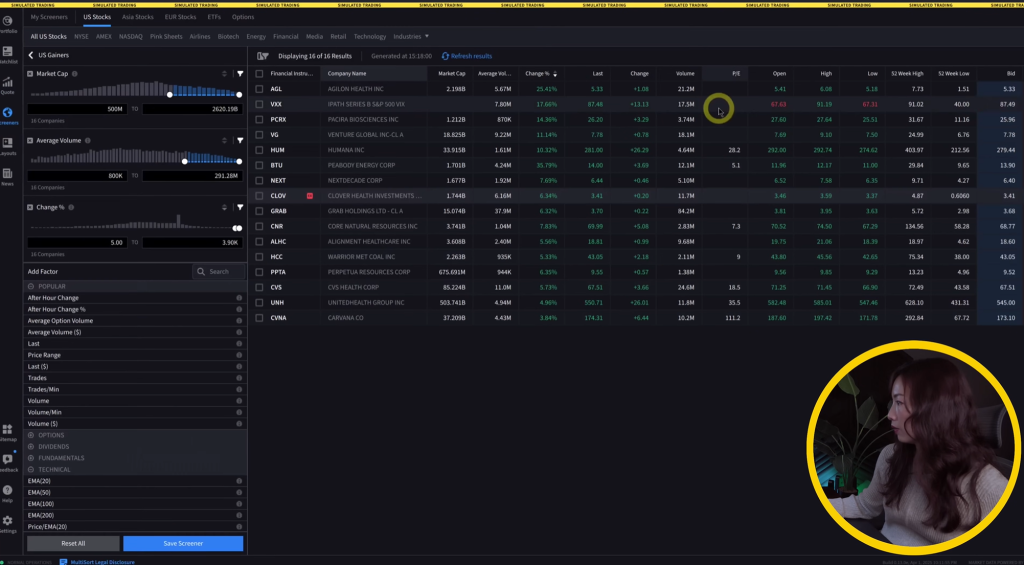
Once the screener’s open, you’ll see a bunch of filtering criteria. Add specific parameters based on what you’re after in stocks.
Set up multiple conditions—just click to add new criteria and set your requirements for price, volume, market cap, whatever matters to you.
After you dial in your parameters, the scanner lists stocks that fit. You can tweak the criteria any time to narrow down your results.
Organizing and Arranging Results
Results show up in a table with lots of columns. Click the column headers to sort—once for ascending, again for descending. It helps you spot the top or bottom stocks in any category.
Add or remove columns as you like. Right-click the headers to open the customization menu and pick which data points to show.
Filtering options let you narrow things down even more after the scan. Use the filter boxes at the top of each column for exact values or ranges.
Storing and Organizing Scanners
Once you’ve set up a scanner, save it for later. Click the save icon, give it a name you’ll remember.
Your saved scanners show up in a list for quick access. No need to rebuild them every time.
To use a saved scanner, click load and pick from the list. It’ll open with all your settings just as you left them.
Edit saved scanners any time—load, tweak, and save again. You can overwrite or save as a new version with a different name.
If you don’t need a scanner anymore, delete it from the manage scanners menu. Keeps things tidy and focused on what you actually use.
Try out Interactive Brokers
Accessing News and Analysis
Accessing the News Panel
Add a news window to your workspace from the main toolbar. The news panel shows current market updates and company headlines that matter for your trades.
Drag the news window wherever you want it. A lot of traders keep it by the portfolio for quick glances. The panel updates automatically as news breaks.
Resize the window by dragging its edges to fit your space. Adjust as needed so you can see news without crowding out your charts or order entry.
Stock-Specific News
The news window can sync with other panels using the color-coded link system. Set the news panel to match your charts and quote details, and it’ll show headlines for whatever ticker you’re on.
Click a new symbol in your watchlist, and the linked news panel updates to show stories for that company. It saves you from digging around for news on each position.
Link Configuration:
Click the link icon on the news window
Pick the same color as your other panels (like orange or whatever you use)
Now, all linked windows update together when you switch ticker symbols
This news integration keeps you in the loop on catalysts, earnings, and headlines that might move your stocks. No need to bounce between tabs or outside sites—you’ve got the info right in your workspace.
Final Thoughts
The IBKR Desktop platform is a noticeable step up from the old Trader Workstation, especially when it comes to user accessibility. You can start with a basic trading template and build out your workspace by dragging in charts, order panels, or quote details—whatever fits your style.
The platform doesn’t have everything—no Level 2 montage or time and sales data, for example. If those are must-haves for your trading style, you’ll want to keep that in mind.
Starred timeframes show up in the chart toolbar for quick access. Star whatever intervals you use most so you can flip between them fast when things get busy.
Prefer a step by step IBKR Desktop tutorial? Watch the video below:
The post NEW: Interactive Brokers IBKR Desktop Tutorial (2026 Full Guide) appeared first on Humbled Trader.